
The object segmentation task can be used to detect objects in your images, e.g. cell detection.
This tutorial assumes that you have read the Tissue Quantification tutorial first, because it basically is an additional step after classification.
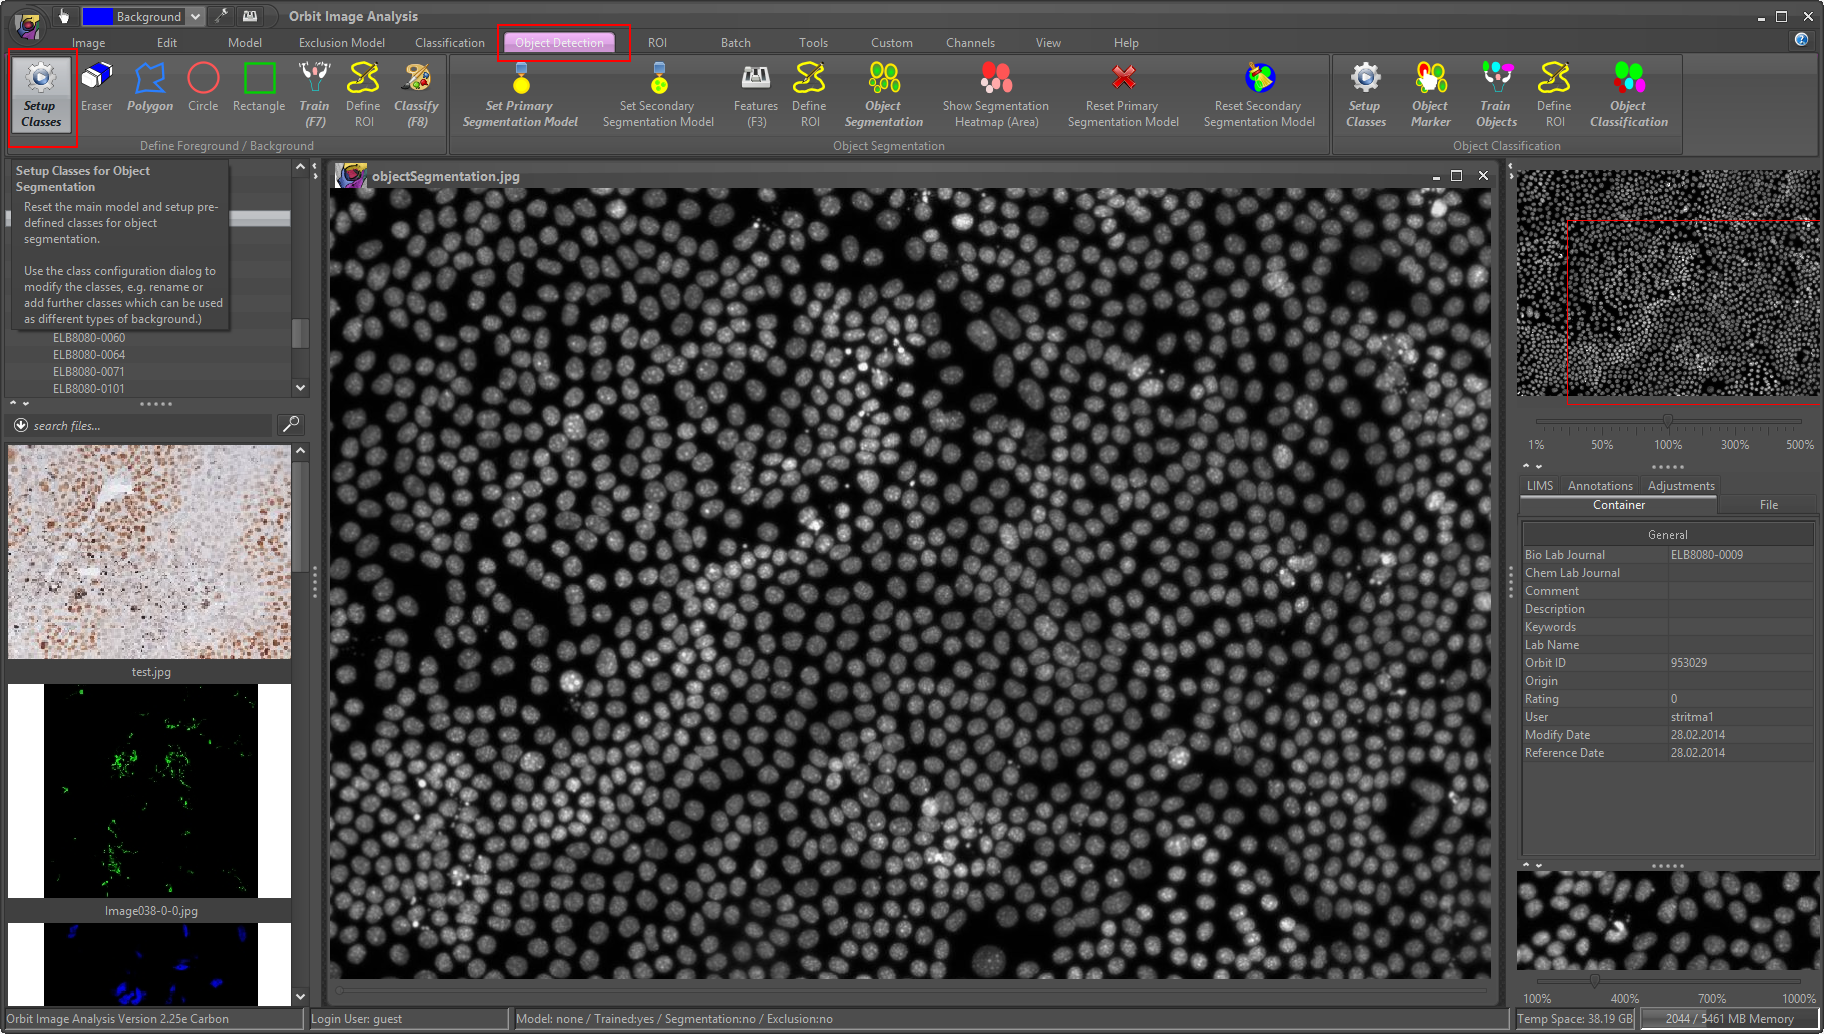
1) First, select the Object Segmentation tab and click on setup classes.
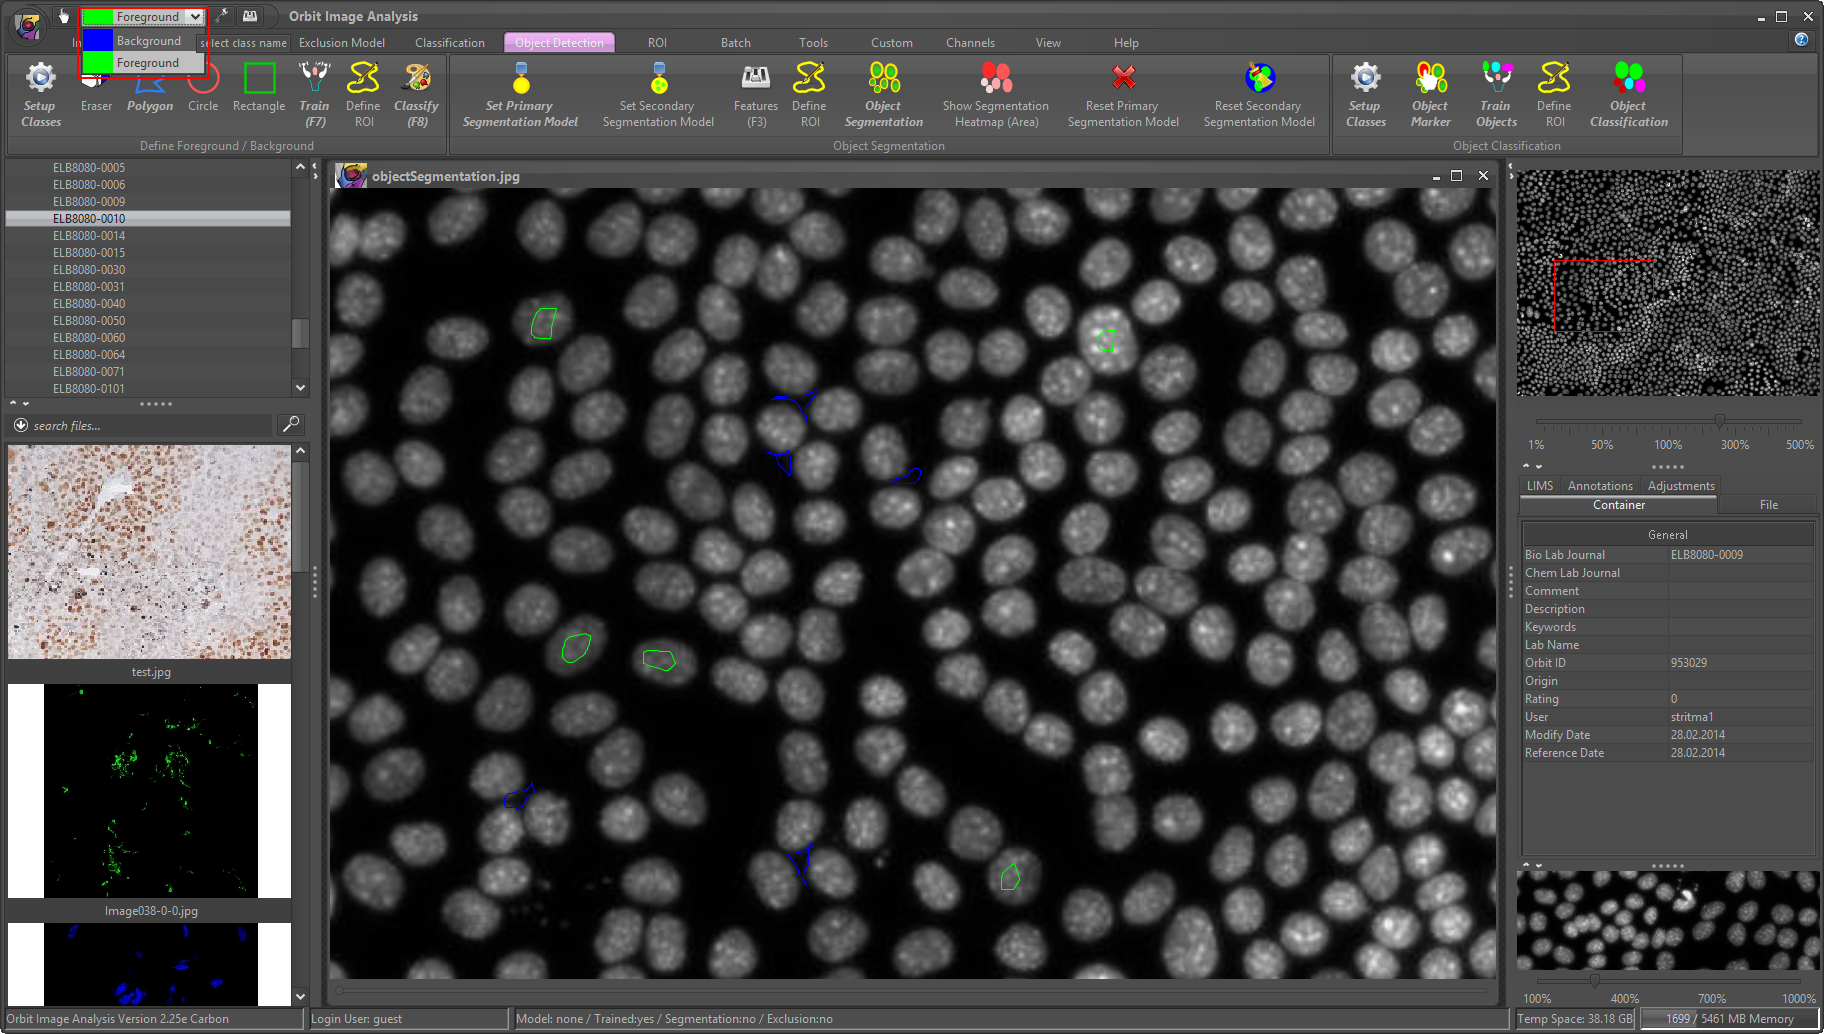
2) The ‘setup classes’ automatically set up two classes for you: background and foreground. Now like for the tissue quantification define regions for each class. That means you draw some background regions and mark some cells with the foreground class. Here it is important to draw especially the background class regions till the border of the foreground class, so really close to cells. Also mark some background regions in the middle of very close cells. This is important that Orbit can separate the cells. Mark some of the darkest and some of the brightest cells.
You might scale up the image to see more details which allows you to draw more precise in between cells.
3) Click on Train (F7) after drawing some foreground and background regions.
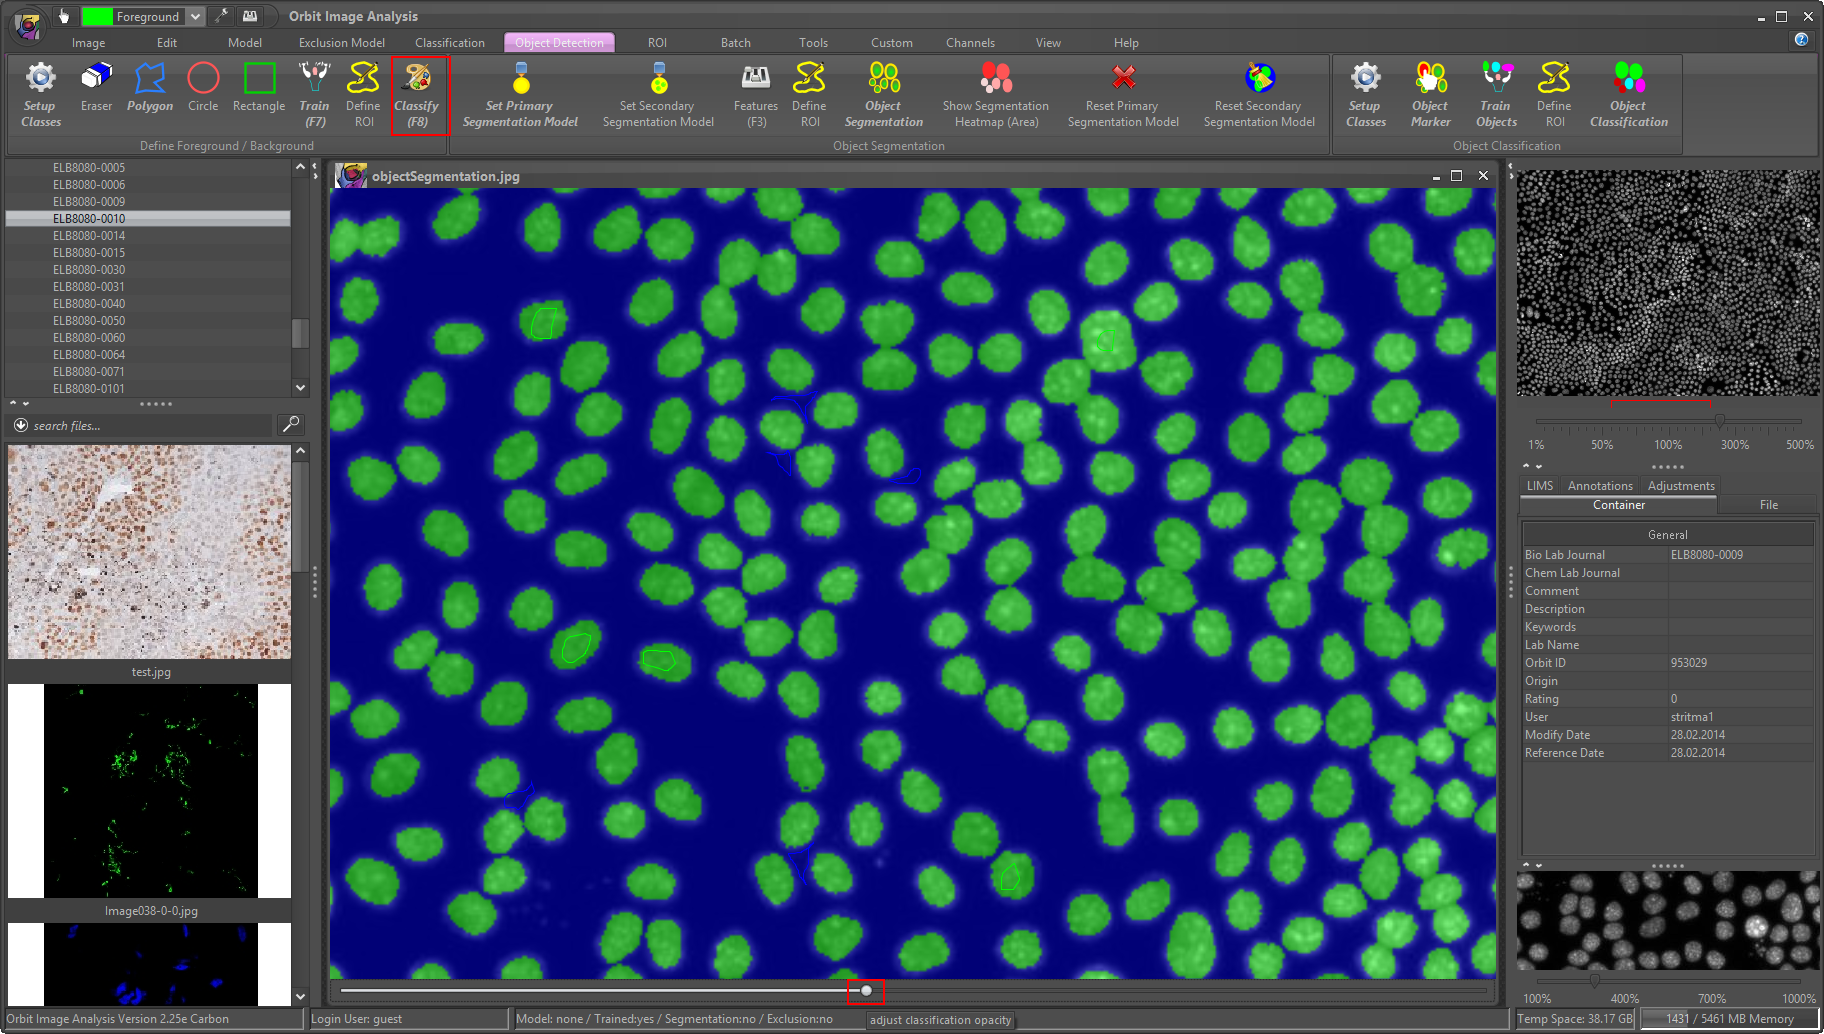
4) Classify (F8) inside a ROI (or the whole image if small) to check if foreground and background are well separated. Drag the class map slider (bottom of your image) to the right to see the classification map.
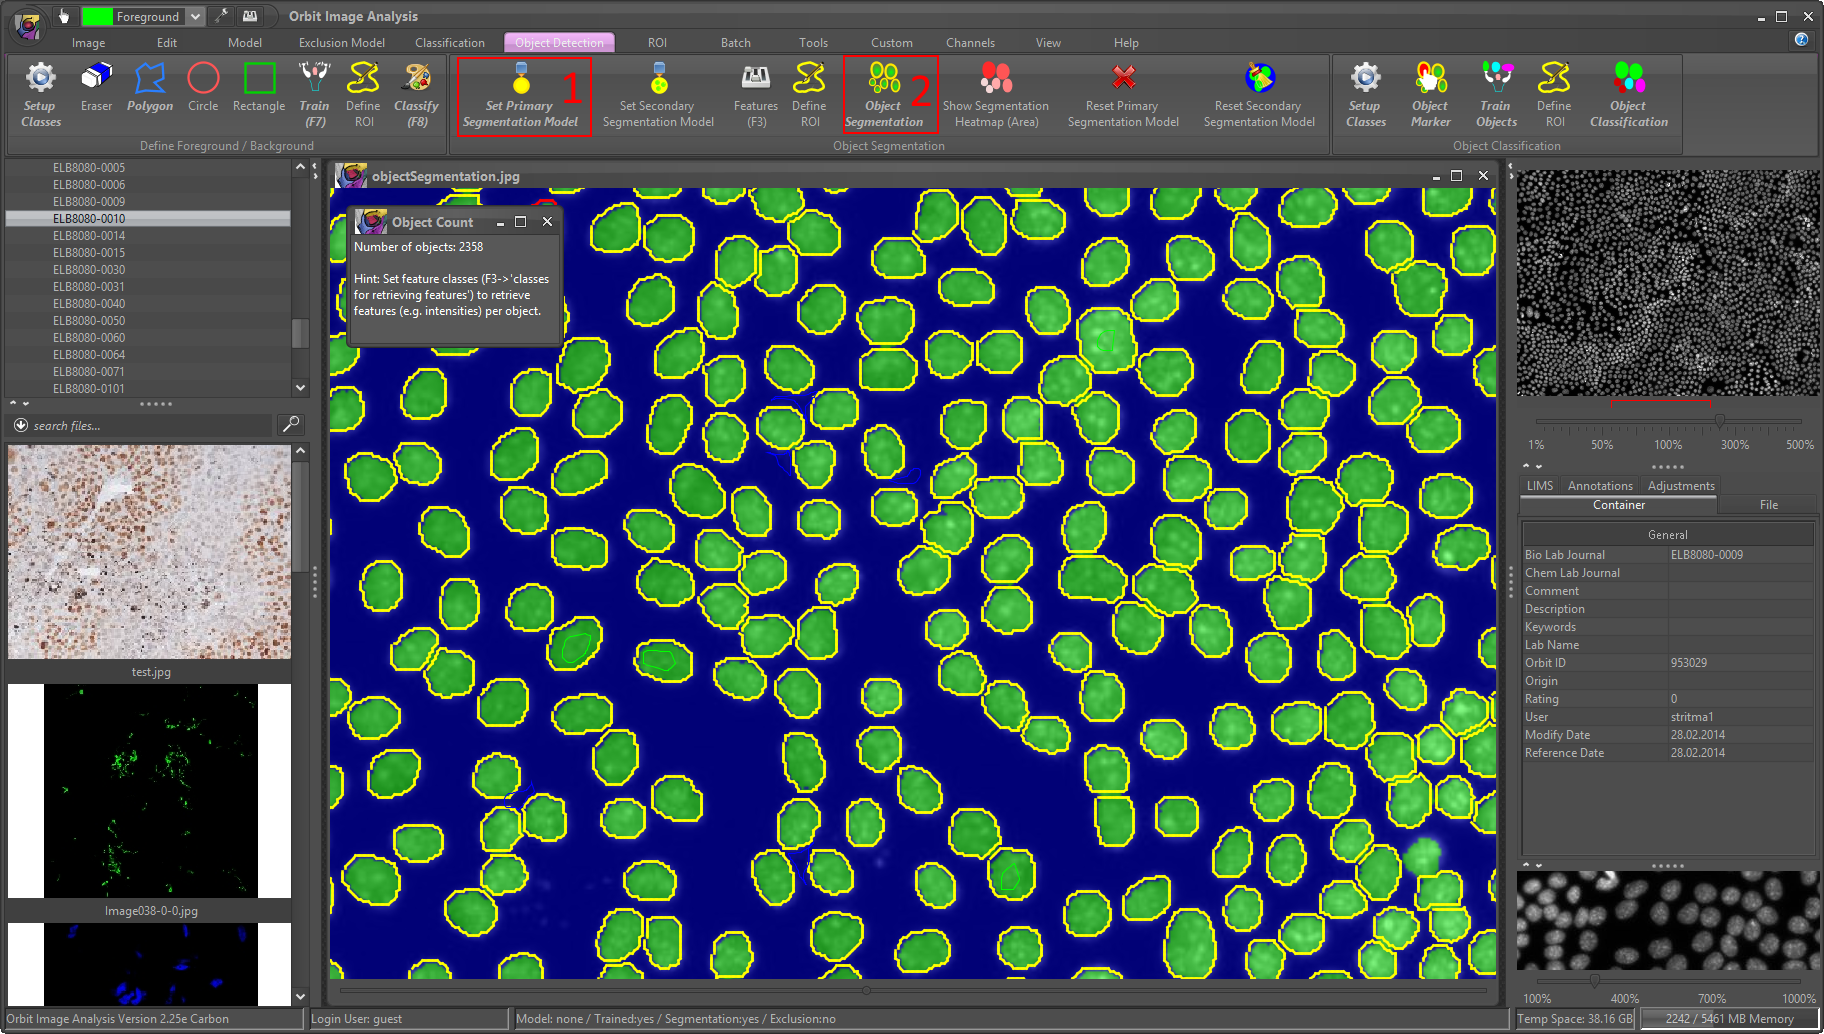
5) If your are not happy with the result repeat drawing more/other regions (step 3). If the foreground (cells) and background are well separated wen can continue and define this model as our so-called segmentation model. To do so, click on ‘Set Primary Segmentation Model’.
After the segmentation model is set you can draw a ROI for testing or use the whole image and click on ‘Object Segmentation’. This segments your cells and shows you the cell count number.
6) You might realize that some of your cells are not segmented, even if the foreground/background detection was good. This means that some cells might have been excluded because they are too small or big. To adjust this open the Features (F3), tab ‘Segmentaion’ and adjust the values. See the Orbit handbook for details about the values. Click on ‘Object Segmentation’ again and see what changed.
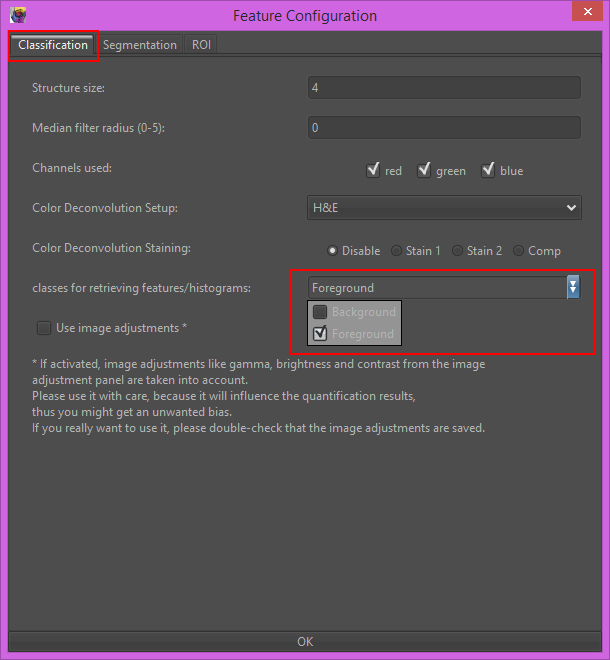
7) Now open the Features (F3) again, tab ‘Classification’ and click in the ‘Classes for retrieving features/histograms’ and add the ‘Foreground’ class (because we want to compute features of cells, not background).
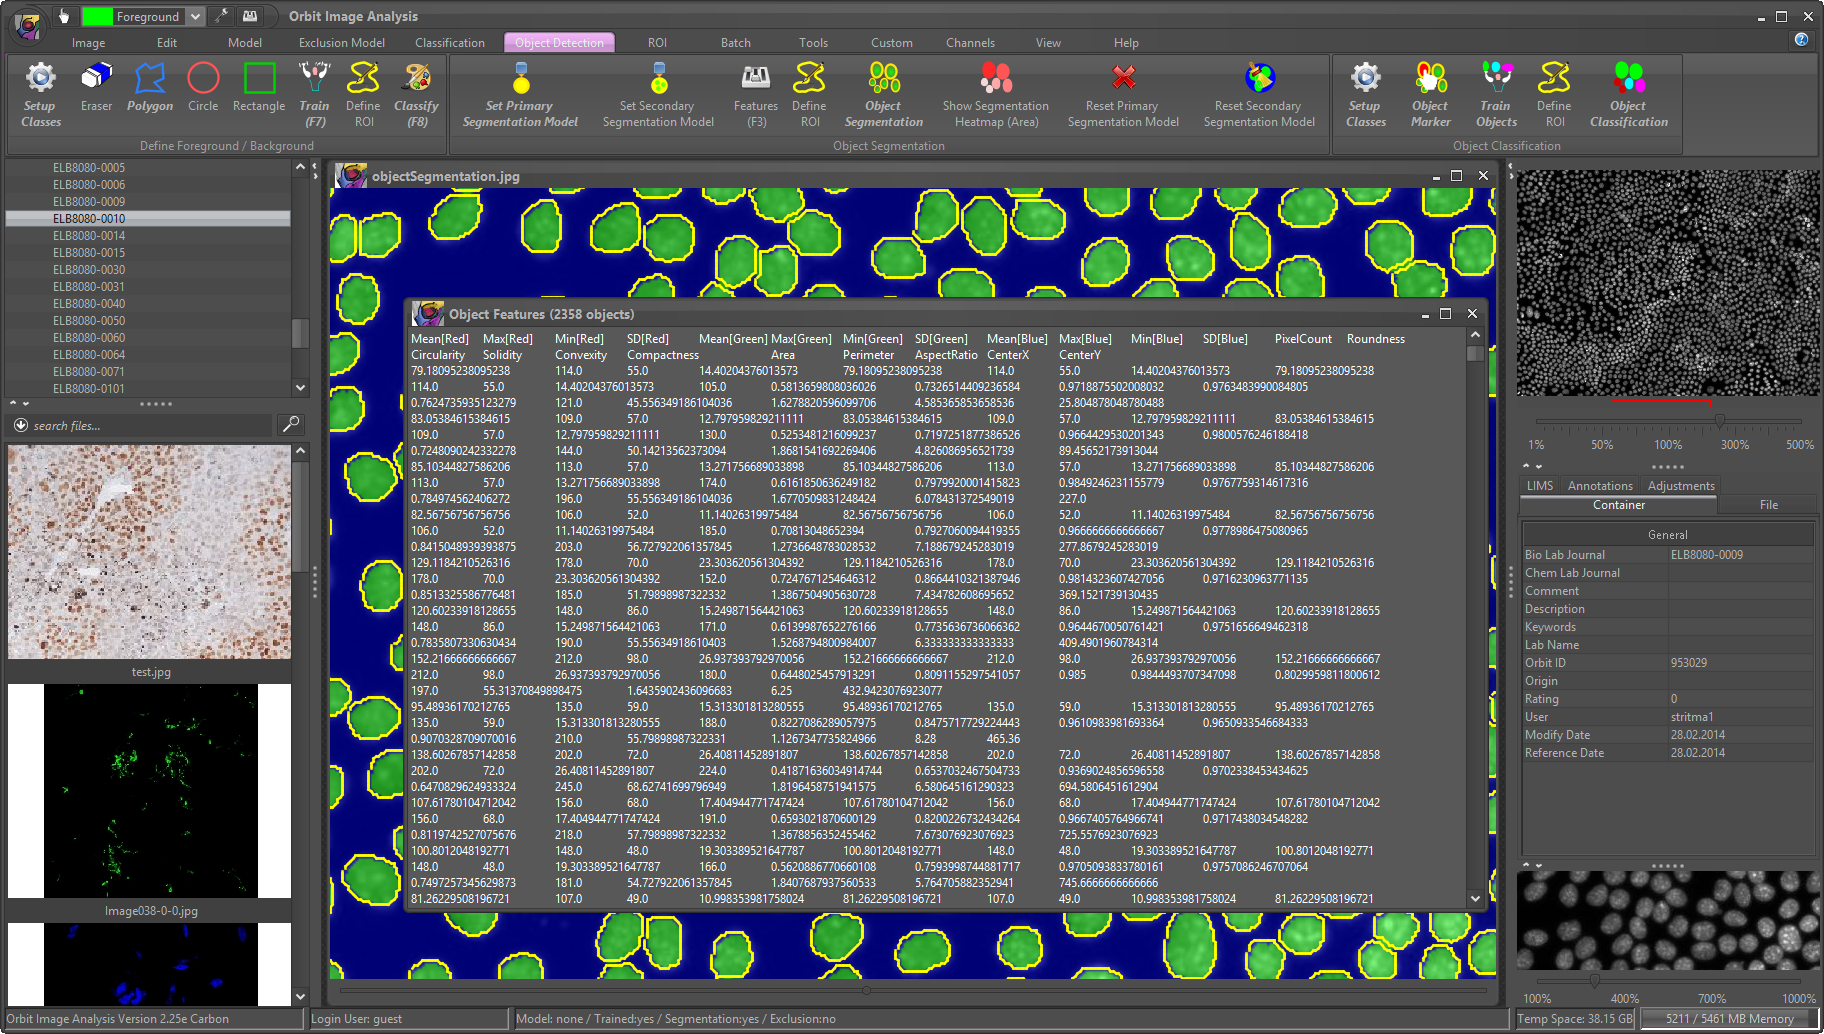
8) Click on ‘Object Segmentation’ again. As you can see this time we retrieve the features (size, mean intensities, shape factors) of our cells, one line per cell. Copy&paste this output in a spreadsheet program like Excel to analyze the data.
If you have cell clusters and cannot separate the cells, please consider using the Mumford-Shah segmentation algorithm!
That’s it! Again, you can save your model and/or apply it to a batch if images usung the Batch -> Execute … buttons.
After segmenting the cells you might want to classify them (e.g. separating bright from dark ones). This is described in the next tutorial, Object Classification.